Core Vs Volatility Portfolio Observations
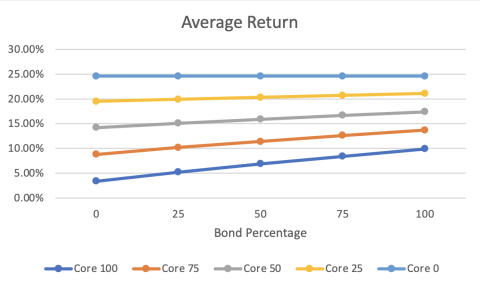
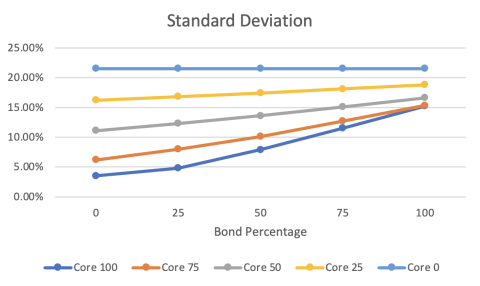
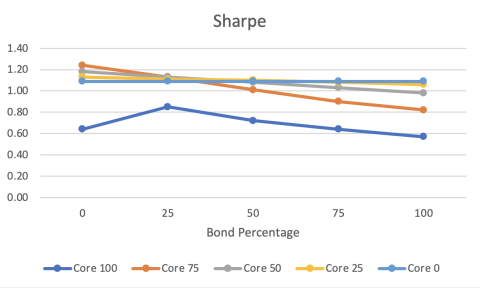
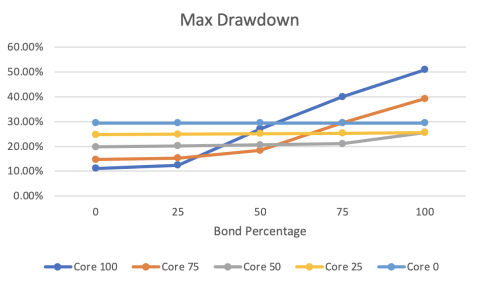
Using the ABR index comparison tool we were able to compare the average return, standard deviation, sharpe, and max drawdown for different types of portfolios. We used a core portfolio which contained a different percentage makeup of bonds and equities and also volatility which is made up of both long and short volatility. With this post, we specifically look into two of the data points where the short and long term volatility levels are equal.
Average return is pretty self-explanatory but can be defined as the average of a series of returns over a certain time period. The higher the average return on a portfolio the more money someone will earn. Standard deviation is essentially a measure of the relative riskiness of an asset or portfolio which means a more volatile stock will have a greater standard deviation than a typical blue-chip stock. Sharpe is defined as the average return earned in excess of the risk-free rate per unit of volatility and when the ratio is higher, the portfolio will have a better risk-adjusted performance. Finally with max drawdown, it is the greatest loss from a peak to a trough of a portfolio, prior to a new peak’s occurrence and is a strong indicator of the downside risk over a period of time. A smaller max drawdown percentage is preferred because it indicates the losses on an investment were small.
The first data point, we will call Portfolio A, is made up of 75% core and 25% volatility. Within these percentages, the core portfolio contains 25% bonds and 75% equity and the volatility is made up of 50% short and 50% long volatility. The second data point, we will call Portfolio B, is made up of 100% core and 0% volatility. With no volatility the entire portfolio consists of 75% bonds and 25% equities. When comparing the two portfolios it was found that portfolio A had a higher average return at 10.20% whereas Portfolio B had an average return of 8.40%. In terms of standard deviation, Portfolio B had a higher standard deviation at 11.50% and Portfolio A was only at 8.00%. Portfolio A had a much higher sharpe at 1.13 in comparison to 0.64 in Portfolio B. Lastly with the max drawdown, Portfolio B more than doubled A at 40.00%, and Portfolio A was at 15.30%.
ABR Data:


